Bitcoin Blasts Above $41K as Traders Seek Higher Targets, What’s Next? (BTC Price Analysis)

Bitcoin’s price has gone parabolic over the last few days, rising almost 10% since the beginning of the month. However, a consolidation or pullback might occur soon.
Technical Analysis
By TradingRage
The Daily Chart
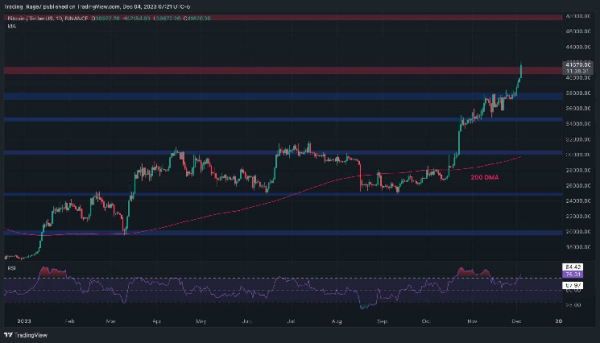
On the daily chart, Bitcoin has been rallying aggressively, breaking above several resistance levels. Following the breakout above $38K, the price has gone almost vertical, breaking past the $40K zone in no time. Currently, the market is holding above the $40K resistance level, and if it can close above the $40K level successfully, there is a considerable probability for a further rise toward the $48K level.
Yet, even in this case, the price will likely experience a consolidation before any further upside move, as the relative strength index is demonstrating an overbought signal.

The 4-Hour Chart
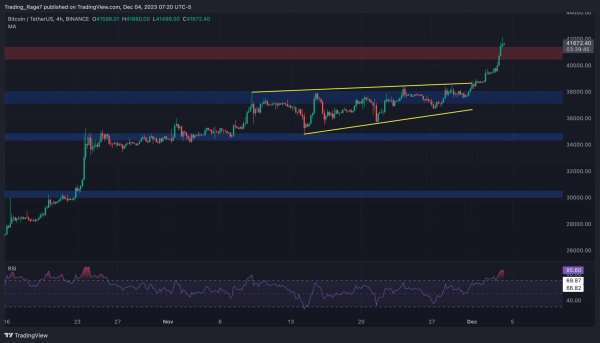
Looking at the 4-hour timeframe, the reason for the recent aggressive rally becomes more clear. The price has broken above the large rising wedge pattern, ending the consolidation period.
Meanwhile, the probability for a pullback is even higher considering this timeframe, as the relative strength index is deep into the overbought territory and the recent 4-hour candles have been showing a decrease in bullish momentum. Therefore, the likelihood of a drop back below the $40K is very high in the short term.

On-Chain Analysis
By Shayan
Bitcoin Binary CDD (SMA 30)
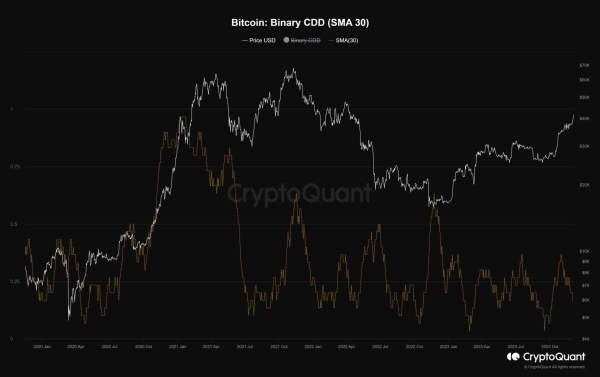
The market appears to be in search of trends, yet significant players are exhibiting a sense of stillness. A closer examination of their behavior is often instrumental in identifying prevailing trends. This behavior is explained through the Binary Coin Days Destroyed (CDD) metric chart, with a 30-day moving average applied.
Binary CDD is a value, indicating ‘1’ if the Supply Adjusted Coin Days Destroyed surpasses the average Supply Adjusted Coin Days Destroyed and ‘0’ otherwise. It serves as an indicator of whether the movements of long-term holders are higher or lower than the average.
At present, the metric has undergone a shakeout concurrent with Bitcoin surpassing the $40K threshold. This signals that long-term holders are relatively stagnant and inactive, suggesting they do not perceive the current rally as an opportune selling moment and may have aspirations for higher price levels.
As long as the metric does not unexpectedly surge, there is no immediate concern regarding selling pressure stemming from the smart money. The stillness observed among long-term holders indicates a certain level of confidence in the ongoing rally, providing a potential signal for continued upward momentum.
