ETH Price Signals Huge Move To $2,400 – Are Bulls Back?

Ethereum although vulnerable to the selling pressure that continues to build up across the crypto market, holds strongly onto levels above $1,800.
The largest smart contracts token has not flinched in the last 24 hours, trading at $1,847 with $5.2 billion in trading volume coming in and backed by $222 billion in market capitalization.
ETH Price Moves Closer to Bullish Pattern Breakout
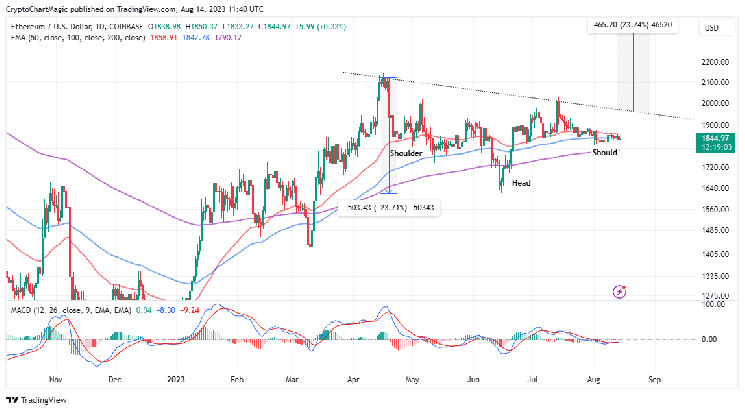
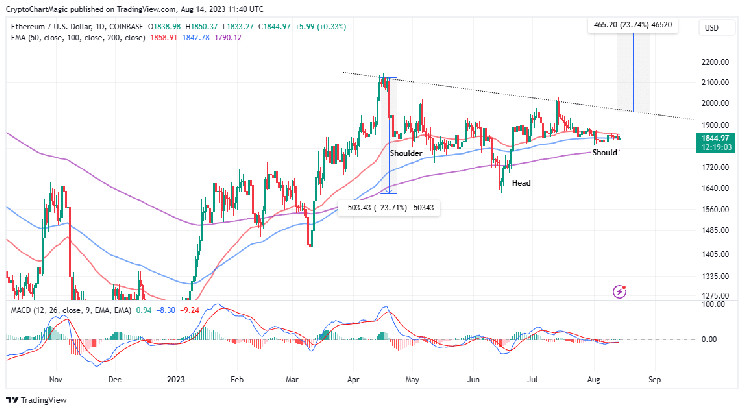
An analysis of the Eth price daily chart reveals the formation of an inverse head and shoulders (H&S) pattern. If validated, investors can acclimatize to a bullish outcome, where Ether climbs to $2,424.
This is a bullish reversal pattern that signals a change in the direction of a downtrend. It consists of three consecutive lows, with the middle one being the lowest and the other two being roughly equal.
The H&S is completed when the price breaks above the neckline, which is a resistance line drawn across the highs of the two pullbacks $1,960 in Ethereum’s case.
Traders can capitalize on this pattern by buying when the price closes above the neckline and setting a stop-loss below the right shoulder. The target price is calculated by adding the height of the pattern to the breakout point, roughly 24% to $2,424.
Like Bitcoin, Ethereum is dealing with low volatility, which according to data from IntoTheBlock, has dropped by 21.2% in a week. This coincided with a massive drop in network fees to $34.8 million, marking a two-month low.
Ethereum fees have dropped significantly this week by 21.2%, reaching a two-month low. This decline coincides with a period of stagnating volatility.#ETH pic.twitter.com/jgk23bbv1v
— IntoTheBlock (@intotheblock) August 11, 2023
Low volatility refers to how much Eth price moves up and down in a specified period. Extended periods of low volatility, according to IntoTheBlock, often point to potential volatile fluctuations in the short term.
From the technical outlook, Ethereum is calm but a bullish breakout is in the offing, especially if the Moving Average Convergence Divergence (MACD) indicator flashes a buy signal.

ETH/USD daily chart | Tradingview
Traders seeking exposure to new long positions in Ethereum would be required to hold on until the MACD line in blue crosses above the signal line in red.
Such a signal implores investors to fill their bags, booking their positions ahead of an impending ETH price rally.
That said, ETH needs to close the day above the immediate resistance highlighted by the 50-day Exponential Moving Average (EMA) (red) at $1,858 to reinforce the uptrend eyeing the inverse head and shoulders breakout.
In the event Ethereum abandons the push for gains above $1,960 (neckline), overhead pressure will likely surge, pushing prices lower below support at $1,800. If declines sustain below this support area, it would be difficult to rule out further losses likely to retest the 200-day EMA (purple) at $1,790, June’s low at $1,620, and the lows in May at 1,405.
Related Articles
- Breaking: Coinbase Officially Launches Crypto Exchange Services In Canada
- Bitcoin Price In Range Under 30k, Miner Accumulation, And Impending Bullish Breakout
- FedNow Adds Hedera Hashgraph’s Partner As Service Provider, HBAR Price Soars 15%